

IPO Prophet®: The IPO Market Oscillator
IPO Prophet® Tools
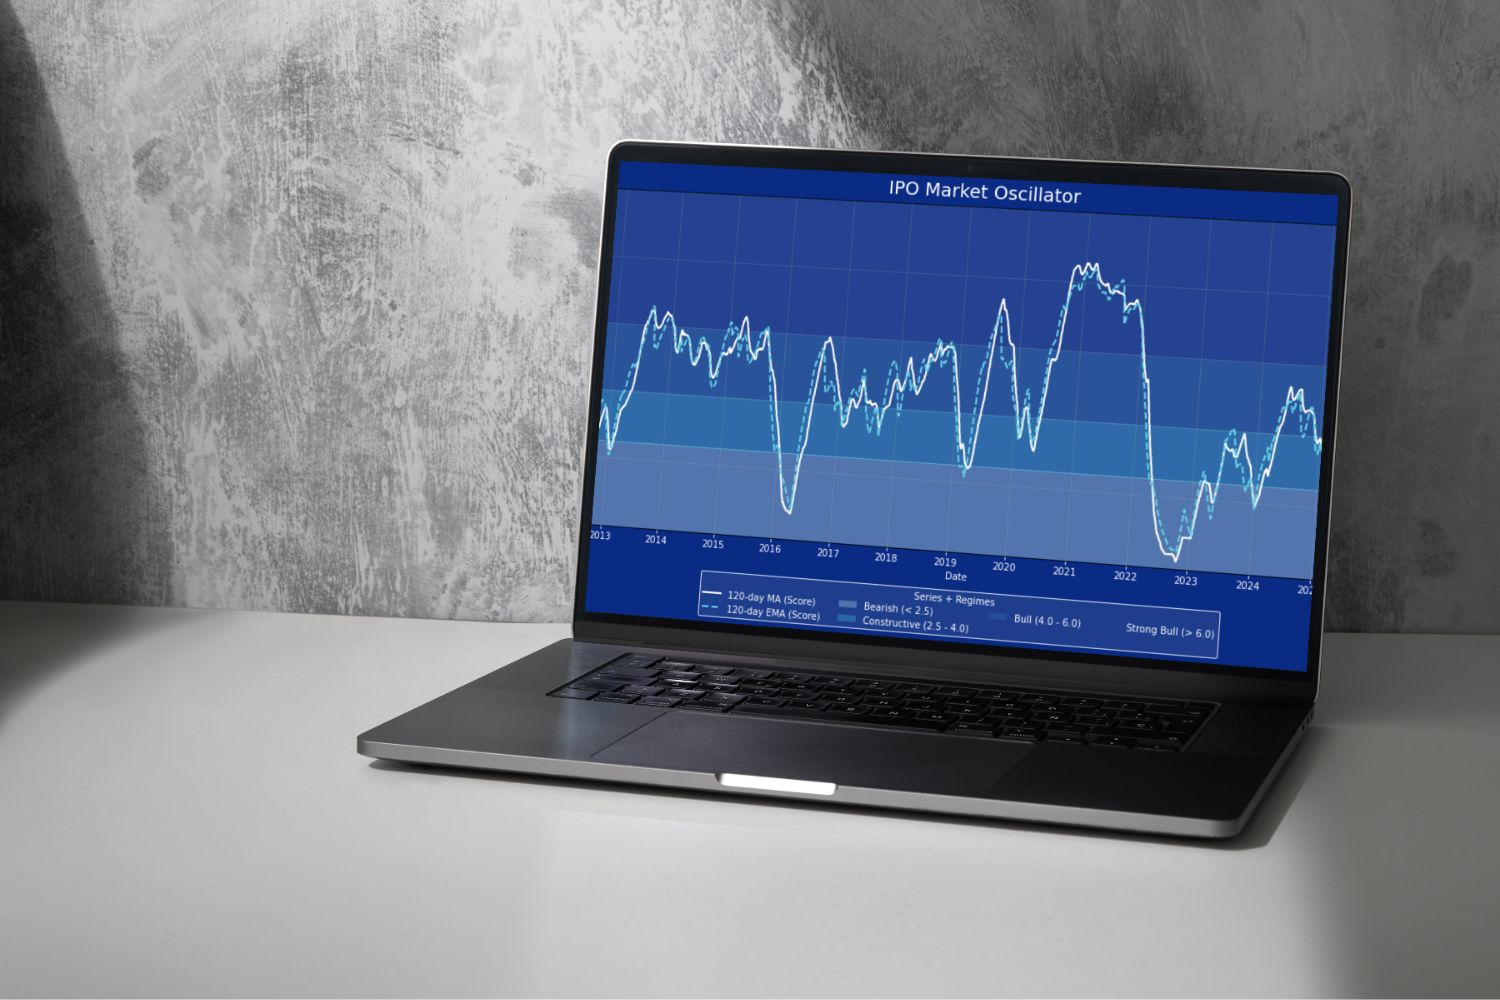
This chart visualizes more than a decade of IPO market regimes — expansions, contractions, early inflection points, and the subtle signals that precede major shifts in issuance. It is the heartbeat of the IPO ecosystem and the foundation of the analysis that follows.
The IPO Prophet® Oscillator is our proprietary regime indicator that measures the health, momentum, and risk appetite of the U.S. IPO market. It indicates whether the window for new issuance is open, closing, or accelerating, using data derived exclusively from newly listed companies.
Traditional equity indicators weren’t built for this corner of the market.
The IPO market has its own seasons, its own behavioral patterns, and its own supply–demand dynamics.
The Oscillator captures those dynamics — quantitatively.
What Is the IPO Market Oscillator?

Anyone who has lived through an IPO cycle knows how dramatically conditions can shift: months of drought, then sudden bursts of activity; streaks of strong debuts, then abrupt reversals. These swings are driven by collective investor appetite for new equity supply, not by broad market indices.
Professionals sense these turns, but intuition isn’t a process.
We built the Oscillator to give issuers, traders, and allocators a repeatable, data-driven measure of where we are in the IPO cycle and how quickly conditions are evolving. It replaces anecdotes and sentiment checks with a grounded, empirical signal.
Why we created it
Without diving into the full technical detail from the blog series, the Oscillator blends multiple aspects of real IPO behavior into a single continuous time series:
1. Recent IPO Performance: How new listings behave over their first days and weeks — the clearest reflection of risk appetite for new issuance.
2. Cohort Breadth & Strength: A healthy market isn’t defined by one hot IPO. It’s defined by broad participation and sustained performance across the cohort.
3. Market Capacity to Absorb New Supply: When investors are willing to accept new issuance, it shows up in the data long before it shows up in headlines.
These inputs are smoothed through moving averages and regime boundaries to create a stable, interpretable measure of market health.
How the Oscillator Works
High-Level View
The Oscillator ranges from 0 to 10, with four distinct regimes:
Bearish (< 2.5): Deals struggle to price. Weak opens and negative drift dominate. Issuance slows sharply.
Constructive (2.5 – 4.0): Early recovery. Buyers are selective but present. Conditions begin to stabilize.
Bull (4.0 – 6.0): Sustained strength. Breadth improves, momentum firms, and pricing conditions turn favorable.
Strong Bull (> 6.0): The window is wide open. Demand exceeds supply. Upside follow-through and accelerated issuance become common.
These levels are based on more than a decade of historical analysis.
Reading the Oscillator
From Bearish to Strong Bull: What Each Phase Means
The Oscillator is built from IPO microstructure, not broad equity factors.
It reflects:
Opening-auction behavior
Early momentum and drift
Absorption and liquidity
Cohort dispersion
Supply–demand balance for new equities
Because it’s grounded in real issuance behavior, the Oscillator often turns before deal activity ramps and captures shifts traditional market indicators overlook entirely.
Why This Indicator Matters
How Microstructure Data Sharpens Market Insight
Professionals rely on this signal to:
Time offerings around favorable market windows
Adjust risk exposure in event-driven trading
Benchmark where we are in the long-term IPO cycle
Make data-informed ECM decisions
Identify early signs of regime change
It provides the scaffolding for anyone navigating IPO market cycles.
Who Uses the Oscillator?
A Tool for ECM and Market-Driven Decision Makers
The IPO market is inherently cyclical. The Oscillator makes that cycle visible, measurable, and actionable.
It gives issuers, traders, and investors a disciplined way to understand where we are — and where we’re likely headed — in one of the most dynamic corners of the market.
Closing Thoughts
For those who want to explore the theory and mechanics behind the indicator:
These two pieces outline the conceptual framework and math underpinning the Oscillator.
Dig Deeper
Recommended Reads

Try it today with zero obligation: full access for 30 days. No hidden fees, no risk. Choose what works, cancel any time.